
Primary care
Phone metrics every primary care practice should track
Call volume hides what patients feel. See the phone metrics primary care practices should track and start measuring. Read on.
Key takeaways
- Abandonment rate, the share of callers who hang up before reaching a person, is the clearest lost-access signal, and the Veterans Health Administration caps it at 5%.
- Measure every phone metric in three windows: peak hours, off-peak hours and after hours, because a healthy daily average can hide a Monday 8am queue.
- Answer rate and abandonment describe the front door, but first-call resolution and call-to-booking conversion show whether the visit actually got scheduled.
- 2care.ai answers calls at any hour, so after-hours demand becomes its own measurable line instead of a voicemail pile that nobody counts.
- With 95+ integrations, 2care.ai can read booked outcomes from the practice schedule, so conversion is counted from the system of record.
Call volume tells you how busy the phones were. These measures tell you which patients got through and which ones gave up.
Primary care practices should track answer rate, abandonment rate, speed of answer, first-call resolution and call-to-booking conversion, each split into peak, off-peak and after-hours windows. Call volume only counts demand. These metrics show how many patients reached a person, how long they waited, and whether the call ended with a visit on the schedule.
Ask a practice how many calls came in last month and the number is easy to find. Ask how many of those callers got what they needed and the answer is much harder to find. A call count shows how much demand reached the phone line. It does not show whether a patient reached a person, got an answer, or left with an appointment.
That is the gap between volume and access. A practice can report a record call month and still be losing patients at the front door, because the log counts what rang and not what was answered.
The metrics below are the ones a practice manager can pull from a phone system report, or from a simple tally sheet if the phone system reports nothing. Each one is defined, given a reference point where a credible one exists, and tied to a decision it should change.
Why call volume misleads a primary care front desk
Call volume rises when the practice is doing well and when it is doing badly. A flu week, a billing statement that confused patients, and a new provider joining all push the number up. Nothing in the number says which one happened.
Volume also hides concentration. In a March 2026 MGMA Stat poll of 294 practice leaders, 36% reported that 11% or more of their calls go unanswered or reach voicemail at peak hours. A practice with that profile can sit near a respectable average across the full day while failing every patient who calls between 8:00 and 9:30.
Phone remains the main route in. MGMA found in July 2025 that 71% of medical groups have fewer than one in four patients scheduling digitally, and in the December 2025 poll of 236 practice leaders, 22% named phone access as their top patient access focus for 2026. When the phone is the front door, a metric that only counts knocks is the wrong instrument.
Answer rate and abandonment: who got through
Answer rate is calls answered by a person divided by calls received. Abandonment rate is calls that ended before anyone answered divided by calls received. Together they split every incoming call into reached or not reached.
The Veterans Health Administration publishes the one audited standard cited for clinical phone lines: no more than 5% of calls unanswered. A VA study across 285 facilities in fiscal years 2015 and 2016 recorded abandonment falling from 12.0% to 8.3% as average speed of answer fell from 87 to 69 seconds, though the authors framed that as an association and not proof of cause.
Count abandonment separately from voicemail. A patient who leaves a message is a different case from one who hangs up silently, and the second kind never appears in a callback list. Ask the phone system for calls that ended in the queue or during ringing, and treat any call under about 10 seconds as an abandoned call only if your system cannot tell a misdial from a hang-up.
Speed of answer and hold time
Average speed of answer is the mean number of seconds between the first ring and a person picking up. It is easy to report and easy to distort, because a few long waits and many instant answers average out to something that sounds fine. Service level repairs this: the share of calls answered inside a stated threshold, written 80/30 for 80% within 30 seconds, which is the VHA standard for primary care scheduling and pharmacy calls.
A service level quoted without its threshold cannot be compared with anyone else's, so always write both numbers.
Hold time matters because patients have a limit. In a May 2025 survey of 2,000 Americans, conducted by Talker Research for Klara, respondents said they would wait about 10 minutes on hold before hanging up on a new doctor's office, while 48% listed an inability to speak with a human as a turn-off. Track the longest wait each day, not only the average. The longest wait is the call that became a one-star review.
Outcome metrics: booked, resolved, repeated
Reaching a person is the first test. The second is whether the call accomplished anything. Three outcome measures cover it.
First-call resolution is the share of calls fully handled without a transfer, callback or second call. Call-to-booking conversion is the share of scheduling calls that end with an appointment on the schedule. Repeat contact rate is the share of callers who call again about the same issue within two days. A rising repeat rate can mean the first answer was incomplete, such as a refill request that was logged but never routed.
In the March 2026 MGMA poll, practice leaders ranked eligibility and prior authorization as the most time-consuming phone category at 45%, with scheduling at 31%, intake at 9% and prescription refills at 6%. Those categories deserve separate tallies, because a practice that blends them into one resolution number cannot tell whether its problem is scheduling or paperwork.
After-hours and peak-hour splits
Every metric above should be cut three ways: peak (the first 90 minutes of the day and the hour after lunch for most clinics), off-peak, and after hours. The split is where the actionable finding sits.
After-hours calls are the most neglected line. A practice with a voicemail greeting records them as messages, and the messages get returned the next morning in a batch that competes with the Monday rush. By then the patient who needed an appointment may have booked elsewhere, so the callback finds a number that no longer needs it.
If your phone system cannot split by window, start with a sheet: for two weeks, have the person who opens the practice count voicemails left overnight and how many were new-patient or scheduling requests. Two weeks of tally is enough to show whether the after-hours line is a rounding error or a daily leak.
The metric set at a glance
| Metric | How to calculate | What it shows | Reference point |
|---|---|---|---|
| Answer rate | Calls answered by a person / calls received | Whether patients reach anyone | Set a baseline per window |
| Abandonment rate | Calls ended before answer / calls received | Patients who gave up | 5% or less (VHA) |
| Service level | Share answered within a threshold, such as 80/30 | Speed, consistently | 80% within 30 seconds (VHA) |
| Longest hold | Longest single wait each day, in minutes | The worst patient experience | About 10 minutes before hang-up (Talker Research, 2025) |
| First-call resolution | Calls handled without callback / total calls | Repeat work created by the front desk | Set a baseline per call type |
| Call-to-booking conversion | Scheduling calls that end in a booking / scheduling calls | Revenue and access in one number | Set a baseline per window |
Where the reference column says set a baseline, no credible published primary care figure exists to borrow. Measure your own for four weeks, then improve against it.
A worked example with your own numbers
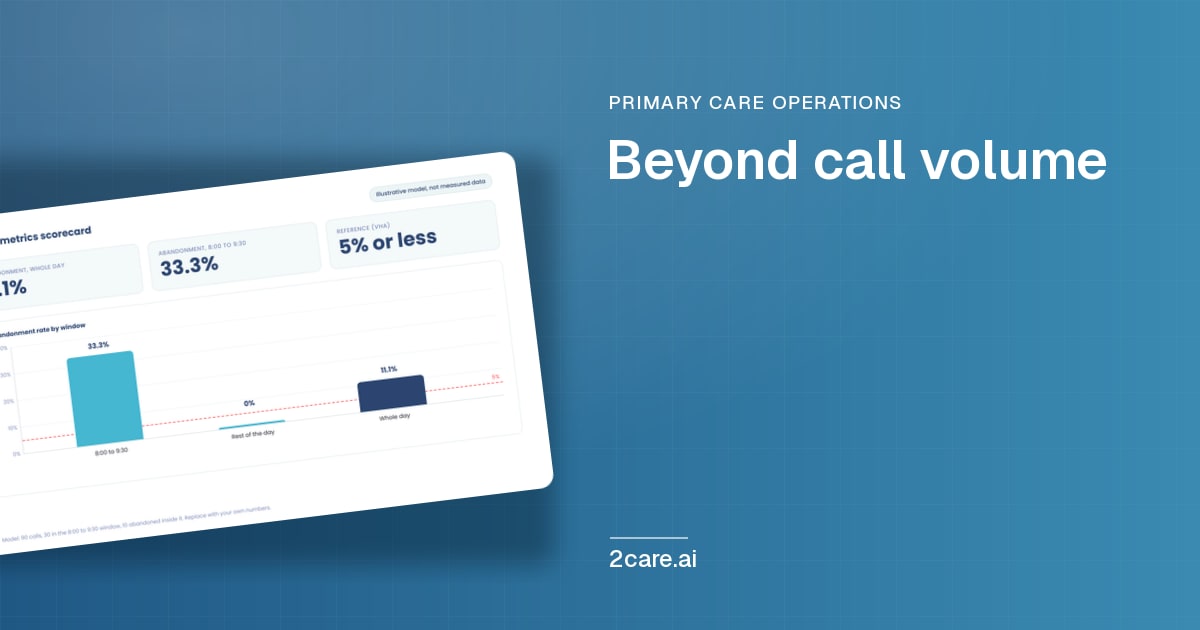
33.3%
This is a model, not a measurement. Every input is an assumption, so replace each one with your own.
Assume a practice receives 90 calls on a Monday. Assume 30 of them arrive between 8:00 and 9:30. Assume 10 of those 30 end before anyone answers, and none of the 10 call back.
The daily abandonment rate is 10 divided by 90, or 11.1%. The rate inside the 8:00 to 9:30 window is 10 divided by 30, or 33.3%. The average says the practice is a few points over the 5% reference. The window says one caller in three failed.
Now assume 4 of the 10 were scheduling requests. That is 4 unbooked visits on one Monday. If every working day in a 21-day month looked like this one, the figure would be 84 unbooked scheduling calls. Multiply by your own average visit value to price it. The point of the arithmetic is the first line: the same day produces two very different numbers depending on whether you cut it by window.
What 2care.ai changes about phone measurement
The measurement problem is that the phone system reports calls and the schedule reports visits, and nobody joins them. 2care.ai answers calls at any hour, which turns the after-hours window from a voicemail pile into a counted line with its own answer rate and its own booking conversion.
Because 2care.ai connects to 95+ EHR and practice management systems, a booked appointment can be checked against the practice schedule itself. That makes call-to-booking conversion a number the practice can verify in its own system, not a figure reported by the vendor. See our EHR integrations for the systems covered, and our guide to after-hours call handling for how the overnight window is set up.
Where this is right for a primary care site
This approach fits a practice that already feels the Monday morning squeeze, runs one to a few providers, and has a schedule in an EHR it can connect. It fits when the front desk spends its first two hours on the phone and not on patients standing at the counter.
It is the wrong tool in two cases. A practice whose schedule lives in a system with no integration cannot have booked outcomes checked against that schedule, so conversion would need a manual tally. And a practice whose real constraint is too few appointment slots will not fix that by answering more calls. In both cases the six metrics above still work, and measuring them first costs nothing.
Frequently asked questions
What is a good call abandonment rate for a primary care practice?
The Veterans Health Administration standard is no more than 5% of calls unanswered, and that is the audited reference most cited. Measure it by time window as well as daily, because a practice can meet 5% across the day and still miss one caller in three during the Monday morning peak.
How do I measure phone metrics without a call analytics tool?
Start with a tally. For two weeks, record calls received, calls answered by a person, and voicemails left overnight, each by time window. Most phone carriers also export a call log with call length. Calls that ring and end within seconds are your best proxy for abandonment until you have proper reporting.
What is the difference between answer rate and service level?
Answer rate is the share of calls a person eventually answered. Service level is the share answered within a set time, written 80/30 for 80% inside 30 seconds. A call answered after six minutes counts toward answer rate but not service level, which is why both belong on the report.
How often should a practice review its phone metrics?
Review the report weekly for the first two months, then monthly. Weekly review catches a staffing change or a new patient mailing that shifts call patterns. Look at the three windows and the longest daily hold first, since those move before the daily average does.
Practical next step
This week, pull seven days of call logs from your phone carrier or system. For each day, count calls received and calls answered by a person during 8:00 to 9:30, and again for the rest of the day. Divide to get the answer rate in each window. If the two numbers differ by more than a few points, you have found the window to fix first, and you have done it with no new software.
Next step with 2care.ai
Want to see your own answer rate by window, including after hours? Book a 2care.ai demo and we will walk through the metrics above on your call data.
More stories
All posts

Get every new post by email
Notes from the front desk, sent as they publish - every Tuesday and Friday. No filler.
I agree to receive the 2Care AI newsletter. Unsubscribe anytime.